
Why Equipment Failure Analysis Falls Short Without a Criticality-Driven Asset Strategy

How reliability teams can move from fixing what just broke to protecting what matters most.
A pump fails on a Tuesday afternoon. The team pulls the bearing, runs a root cause investigation, finds contamination in the lubricant, corrects the seal, and closes the work order. On paper, this is failure analysis done well: a defined trigger, a documented cause, a corrective action.
What it does not answer is a more important question: should this pump have failed in the first place, given what its failure actually costs the plant?
That question belongs to criticality, not to root cause analysis, and conflating the two is where a great deal of reliability effort quietly goes to waste.
Failure Analysis Does One Job Well, and Stops There
Root cause failure analysis (RCFA) and fault tree methods are built to answer a single question: why did this specific failure happen? Practitioners writing for this publication have described the discipline well.
One piece on an offshore directional-drilling actuator traced a repeated motor failure back to how components were assembled during manufacture, rather than to the side load that first inspection blamed, and made the case for pulling the original equipment maker’s engineers into the investigation rather than stopping at a generic repair (a manufacturer’s-eye account of failure analysis on drilling actuators).
That is exactly what good RCFA looks like: rigorous, evidence-based, and scoped to the failure in front of you.
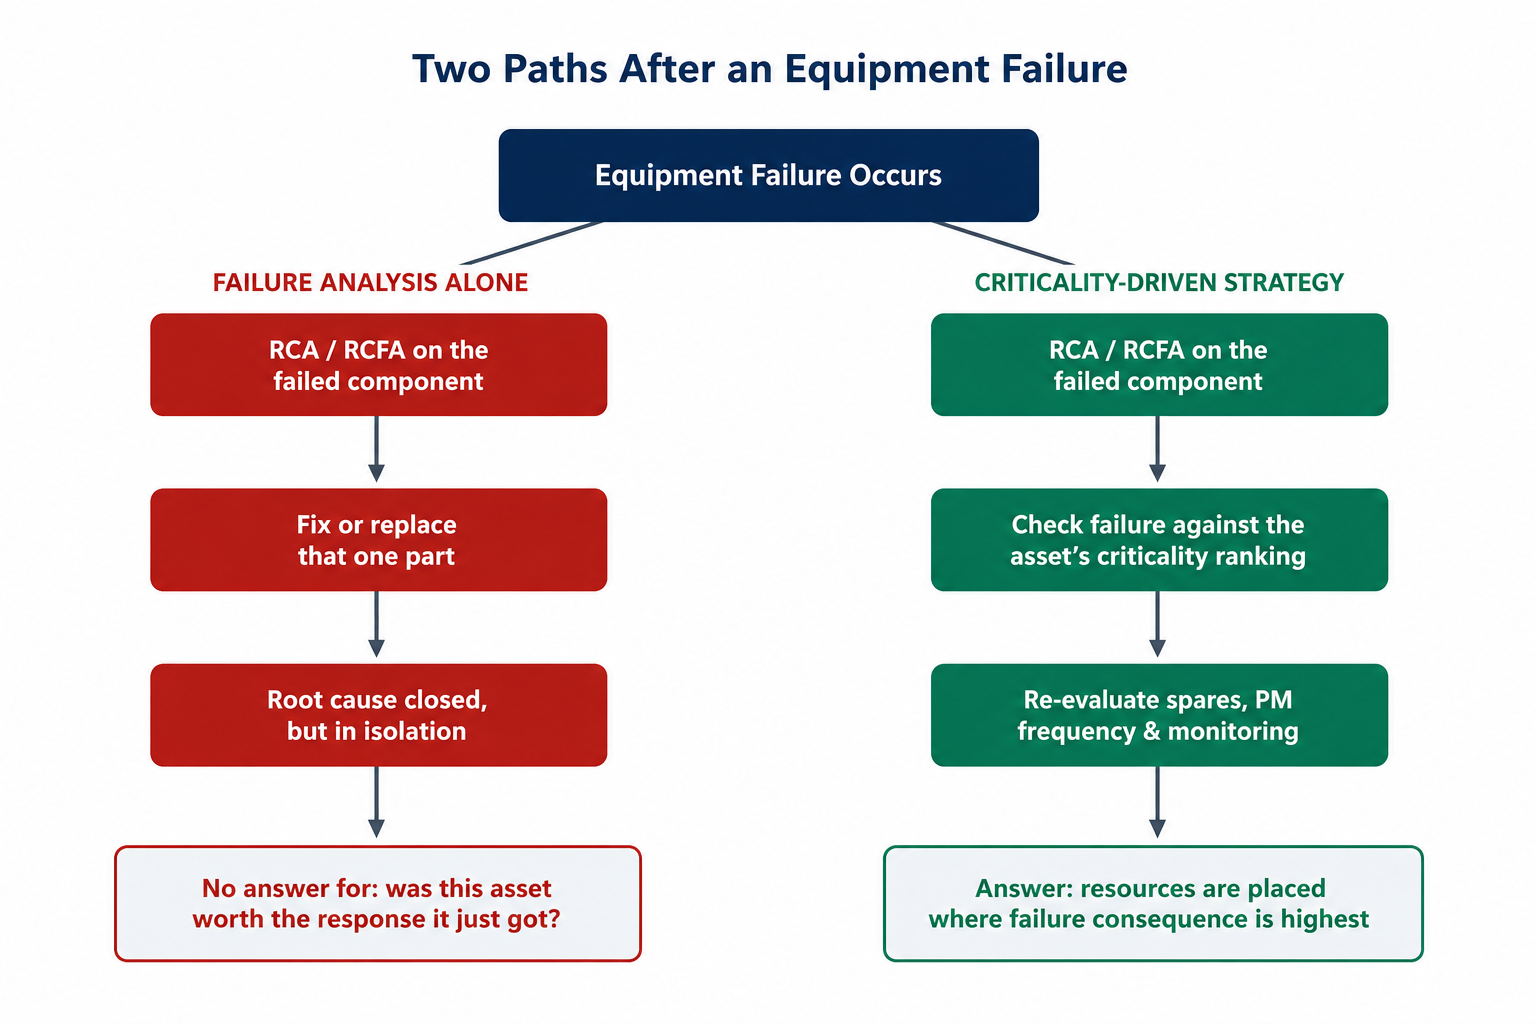
Scoped to the failure in front of you is also the limitation. RCFA and FMECA are deliberately narrow: they investigate one failure mode, or one component’s failure modes, in isolation.
Neither method, by design, asks whether the asset that failed deserved a faster response, a bigger spares buffer, or a different maintenance strategy than the one next to it.
Reliability engineers correcting a root-cause-effect analysis are working on identifying the specific cause-effect chain that produced a failure, not on ranking that asset against every other asset the plant runs. Both jobs matter. They are not the same job.
The Blind Spot: Every Failure Gets the Same Process, Not the Same Consequence
The practical effect of running failure analysis without a criticality layer underneath it is that maintenance organizations tend to treat all investigated failures with roughly the same rigor and the same follow-up urgency, regardless of what each asset’s failure actually costs.
Data from the U.S. Department of Energy’s Federal Energy Management Program, compiled in Plant Engineering’s review of proactive maintenance practices, puts more than 55 percent of maintenance activity at an average facility as still reactive, meaning work driven by breakdowns rather than by a prioritized plan.
The same source notes that reliability-centered maintenance is specifically designed to use equipment criticality to decide where that planning effort should go first, which is the piece a standalone RCFA program does not supply on its own.
The cost of that gap is not abstract. Siemens’ Senseye division surveyed manufacturing and industrial operators for its 2024 True Cost of Downtime research, and found that the world’s 500 largest companies lose approximately $1.4 trillion a year to unplanned downtime, around 11 percent of their combined revenue, up from 8 percent five years earlier.
In automotive manufacturing specifically, the report puts the cost of an idle line at up to $2.3 million per hour. Those figures are dominated by a relatively small share of assets.
A plant that runs the same failure-analysis playbook on a $400 sensor and a $2 million compressor is not under-investing in the sensor; it is under-investing in the compressor, and it usually cannot see that from the RCFA log alone.
Benchmarking work published by Reliabilityweb on world-class maintenance practice puts proactive maintenance at roughly 70 percent of total maintenance hours among the top-performing 20 percent of organizations studied, against a far more reactive mix at the average site.
The gap between average and top-quartile performance is rarely a difference in how well any single failure gets investigated. It is a difference in whether the organization has already decided, asset by asset, where that investigative and preventive effort belongs.
What Criticality Analysis Adds That Root Cause Analysis Cannot
Asset criticality ranking is not a replacement for failure analysis; it is the missing prioritization layer above it. As one contributor to this publication defined it, criticality ranking combines three elements:
- the consequence of failure across production, safety, environment and cost;
- the reliability of the asset itself;
- and, in more detailed versions, how easily a developing fault can be detected before it causes a failure (a framework for building an asset criticality ranking).
That ranking is what tells a team which assets are worth a full RCFA and a fast parts response, and which are not worth the time.
A widely referenced approach to keeping this manageable is what one author calls the criticality spectrum: starting with a coarse system-level ranking, then narrowing to asset-level and, only for the most consequential assets, component-level analysis using RCM or FMECA (a graduated approach to criticality assessment).
The logic is straightforward: detailed failure-mode analysis is expensive in engineering time, so it should be spent on the small share of assets whose failure would actually hurt.
In practice, three scoring approaches dominate industrial criticality programs, and they are frequently combined rather than used alone:
- FMEA-based RPN scoring: Severity, Occurrence, and Detection are each rated on a numeric scale, typically 1 to 10, and multiplied together. A bearing that stops production, fails periodically, and is hard to detect in advance will produce a materially higher Risk Priority Number than a sensor with a minor, easily-caught failure mode.
- Weighted multi-criteria scoring: operational impact, safety exposure, replacement cost, and supplier lead time are each weighted and summed into a single score, which tends to suit organizations that want to fold in factors FMEA does not naturally capture, like spare-parts availability.
- ABC–VED cross-analysis: ABC ranks parts by consumption value, VED ranks them by operational necessity (Vital, Essential, Desirable), and the two are cross-referenced so that a low-cost part that is nonetheless mission-critical does not get deprioritized just because it is cheap.
The output of any of these methods is the same: assets and their spares sort into tiers, commonly Critical, Semi-Critical, and Non-Critical, and each tier is assigned a different maintenance and inventory posture rather than a uniform one.
Turning the Ranking Into a Working Strategy
A criticality score that sits in a spreadsheet and never changes anything is not a strategy; it is documentation.
The organizations that get value from criticality analysis run it as a loop: score assets, tier them, set a differentiated response for each tier, then feed the failure and consumption data that comes out of running that response back into the next scoring cycle.
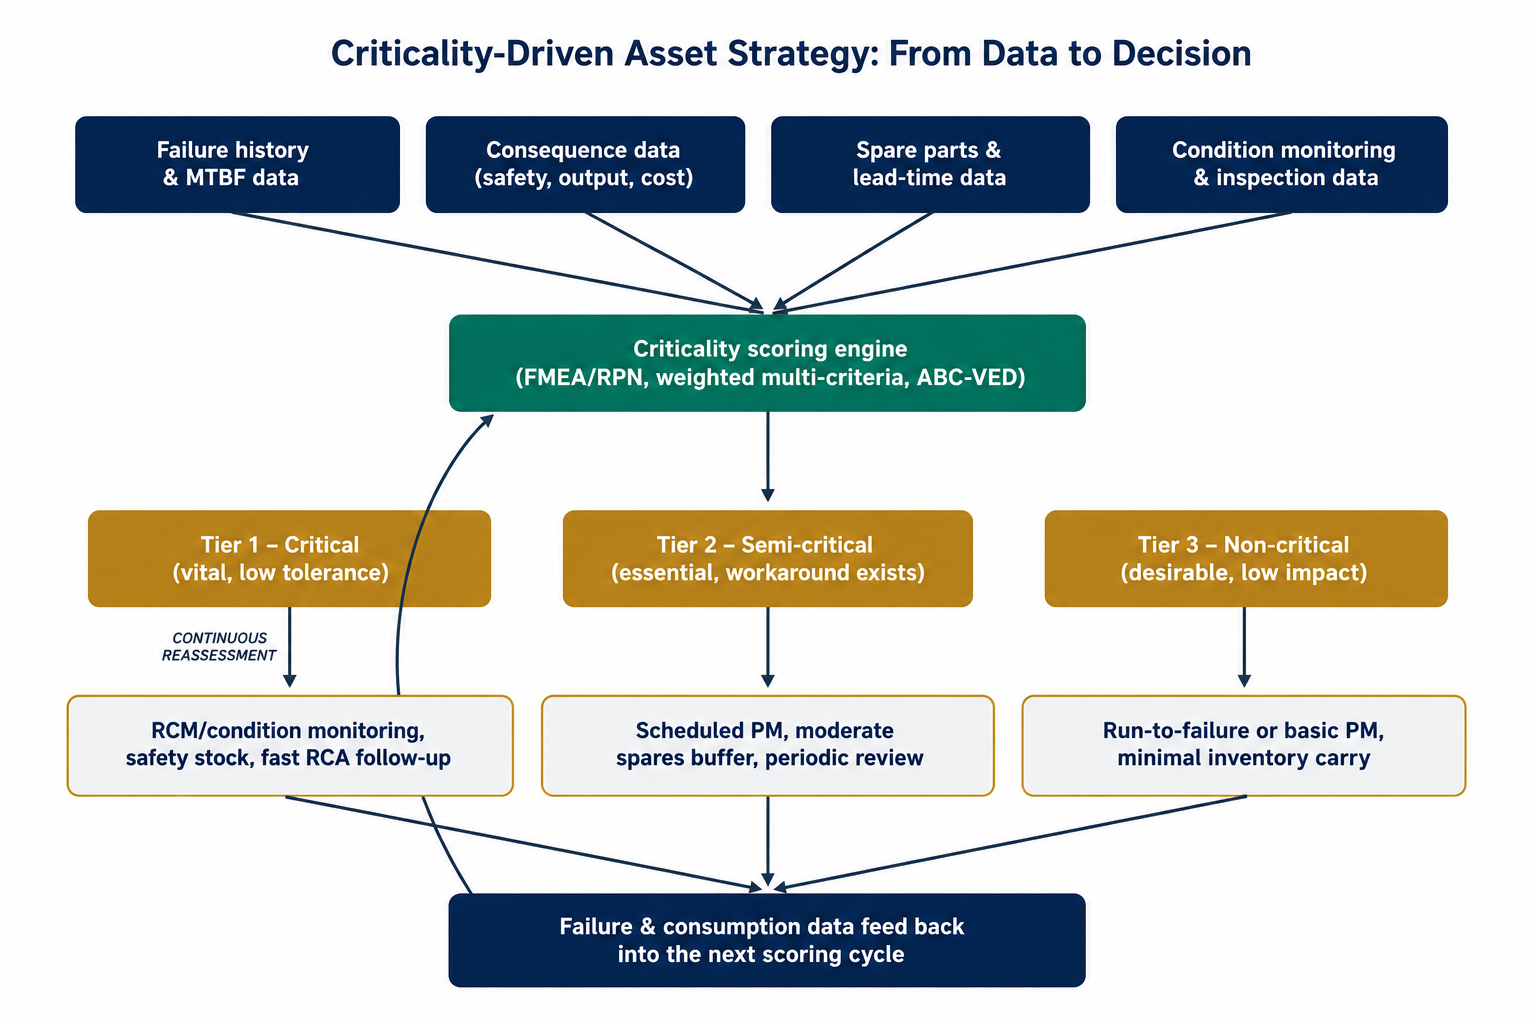
What that looks like tier by tier, in a typical asset-intensive plant:
| Tier | Typical characteristics | Maintenance & spares posture |
|---|---|---|
| Critical | High RPN or top-weighted score; failure stops production, creates a safety exposure, or has a long replacement lead time | Condition monitoring or RCM-based PM, safety stock held on-hand, fast-tracked RCA and corrective action after any failure |
| Semi-critical | Moderate score; failure causes a delay but a workaround or redundancy exists | Scheduled time-based PM, moderate spares buffer, periodic re-scoring rather than continuous monitoring |
| Non-critical | Low score; failure has minimal operational or financial consequence | Run-to-failure or basic PM, minimal inventory carried, ordered on demand |
Where the Gap Shows Up First: Spare Parts
Spare parts inventory is usually where the absence of a criticality layer is felt hardest, because it is the point where a reactive RCFA-only culture and a genuine supply-chain cost collide.
A part tied to a high-consequence asset needs to be on the shelf before the failure happens, not ordered after a root cause investigation confirms what already went wrong.
Frameworks for spare parts criticality typically score parts on production impact, downtime cost, health and safety exposure, and supplier lead time, then classify them into the same Tier 1 to Tier 3 structure used for the assets themselves, and Verdantis, specialist in EAM software solutions, has documented this scoring logic in detail, including worked RPN and ABC-VED examples that map directly onto the tiering approach above.
The point is not that every plant needs identical scoring software. It is that failure analysis findings only compound into better outcomes when there is a criticality ranking sitting underneath them to decide which findings warrant an inventory change, a monitoring upgrade, or a maintenance interval revision, and which do not.
A Practical Way to Combine Both Disciplines
- Score before you investigate deeply. Run a coarse criticality pass across the asset register first, so RCFA time and FMECA depth get allocated to the assets where failure actually matters, rather than spread evenly.
- Feed every RCA back into the score. A confirmed failure mode, a revised MTBF, or a newly identified detection gap should update that asset’s criticality inputs, not just close a work order.
- Tier the spares list, not just the asset list. A criticality score that stops at the equipment level and never reaches the parts bin leaves the most common failure point, a missing spare, unaddressed.
- Re-run the ranking on a cycle, not once. Failure rates, supplier lead times, and production priorities shift; a criticality ranking done once during a reliability project and never revisited drifts out of date within a year or two.
The Real Question Isn’t Why It Failed
Root cause failure analysis will keep telling reliability teams exactly why a given part failed, and that work is neither optional nor replaceable; it is the evidence base every criticality model eventually depends on.
But the question that actually protects a plant’s output, safety record, and maintenance budget is a different one: given everything that could fail here, where does this specific asset rank, and does its current maintenance and spares posture match that rank?
Failure analysis answers the first question. Only a criticality-driven asset strategy answers the second, and running one without the other leaves half the reliability program guessing.
References cited above are linked inline throughout the article.



Subscribe to the free Maintworld newsletter here!

Latest