Preventive vs. predictive
The shift from reactive maintenance to preventive maintenance has been going on already for some decades.
Kaizen is a Japanese word, which translates to English as “improvement” or “change for better”. At least we in Europe during the 80’s and 90’s were following, and carefully analysing and adapting concepts our colleagues in Japan were already using. There was a lot to learn from them we noticed, and today Japan is still one of the international benchmarks for product quality and robustness.
In maintenance the change from an earlier reactive attitude to today’s preventive mindset has also been visible in the workload of an individual maintenance person. Of course, the figures vary between the companies and are based on the nature of the business. However, it can easily be estimated that the portion of preventive maintenance work has grown from 20-30% to 50-70% on average. There is still some gap before we reach the preventive maintenance level of 90% that Japanese colleagues were presenting in the 90’s.
Methodologies like RCM (Reliability-Centred Maintenance) and TPM (Total Productive Maintenance) has been guiding maintenance organisations in their development work towards more efficient maintenance operations and especially defining the actions of preventive maintenance.
The development of digitalisation, including for example increased intelligence in field devices and highly developed analysis software give us the opportunity to further develop the level of preventive maintenance. We talk about predictive maintenance – which is still preventive maintenance, but because of the better understanding of the actual machine condition, we can optimise the timing of the preventive actions.
Some years ago, I saw a market study estimating that the international market of predictive maintenance will grow from 2016 to 2021 with an annual growth rate of around 30%. That did happen. Several new market estimates are again giving similar growth figures for the coming decade. Here at Maintworld we will follow the market development and hopefully be able to deliver our readers the highlights from the market with new inventions and new players. We would also be happy to get your proposals and information so that we can be up to date with the fast development.
The role of artificial intelligence and robotics in the future of work has also sparked a lively discussion as a result of rapid technological development. In this issue of Maintworld, Professors Diego Galar, Ramin Karim and Uday Kumar discuss the topic from the perspective of Maintenance 5.0. Companies also present their own solutions. For example, Mika Kari, Global Technology Director at Valmet Industrial Internet, explains how digitalisation is guiding the development of Valmet’s remote maintenance services, and Erich Labuda, Business Services Manager at ABB, explains how maintenance professionals can improve energy efficiency based on information from energy audits.


Subscribe to the free Maintworld newsletter here!
The SDT340: A complete solution for equipment reliability
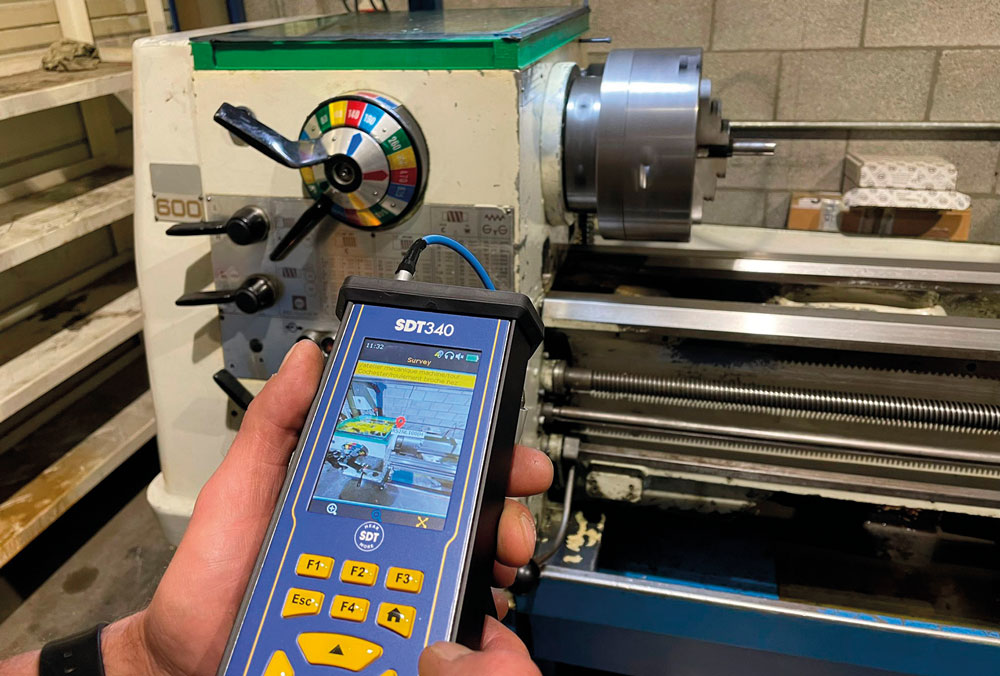
In industrial operations, maintaining the health and functionality of assets is crucial to flawless productivity. That’s where ultrasound technology changes the game, offering a versatile and effective way to detect and treat potential problems before they arise. In this article, we explore the importance of ultrasound inspections, focusing particularly on the advanced capabilities of the SDT340 ultrasound detection device.
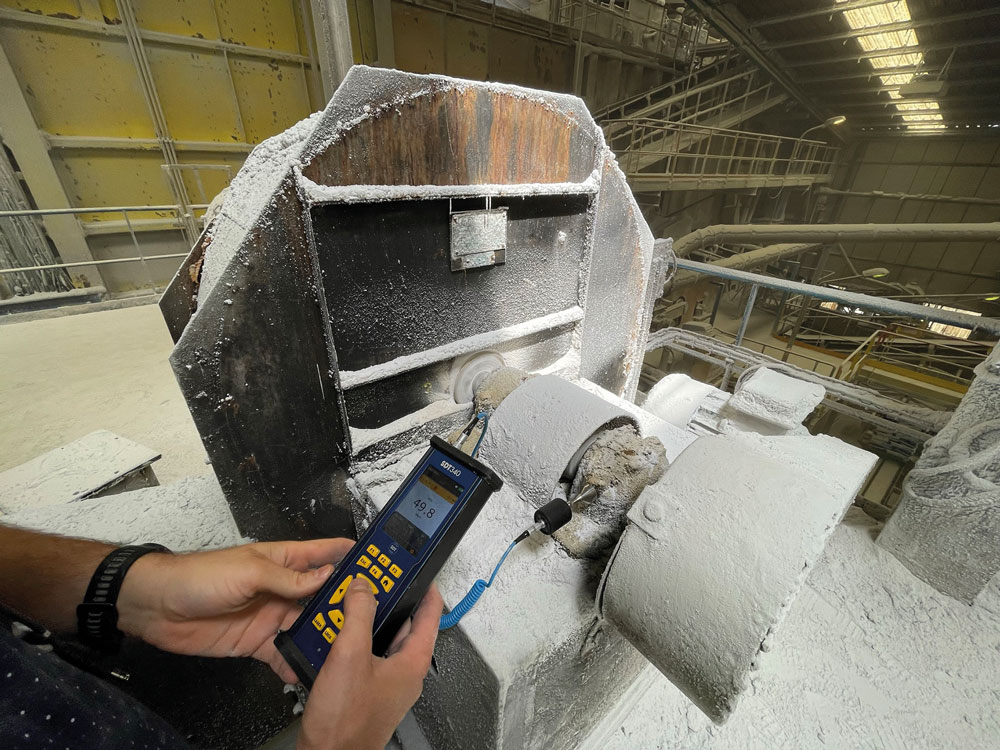
Ultrasound technology enables operators to play a vital role in asset reliability. Simple tasks such as finding leaks, inspecting shaft couplings and testing steam traps can be performed effortlessly by operators with minimal training. This approach not only capitalizes on operators’ familiarity with the assets, but also reduces energy wastage and minimizes unplanned emergency maintenance interventions.
The need for ultrasound in noisy environments
Manufacturing environments are notoriously noisy, making it difficult to detect subtle defects with the naked ear. Ultrasound detectors, such as the SDT340, cut through the noise and identify defects that would otherwise go unnoticed. Its ability to identify faults earlier than other condition monitoring technologies makes it a valuable tool in predictive maintenance strategies.
The detector in detail
The SDT340 is an ultrasound and vibration data collector designed to detect and analyze data from a variety of industrial equipment, providing an all-in-one solution for comprehensive condition monitoring.
It stands out not only for its advanced capabilities, but also for its meticulously designed features that redefine asset reliability management.
One of the most remarkable features of the SDT340 is its compatibility with Ultranalysis® Suite 3 (UAS3) software. This integration facilitates the streamlining process for users, enabling them to effortlessly download and organize inspection results. UAS3 software is not only a data repository, but also gives users the ability to customize their condition monitoring strategies, tailoring the approach to the unique needs of their industrial equipment.
One of the outstanding features of the SDT340 is its information screen, which gives users direct access to crucial information. This includes images of the machine to be inspected, specific examination points and required sensors, all imported seamlessly from the UAS3 software. This intuitive design improves the efficiency of field inspections, enabling operators to access vital data without unnecessary delay.
The SDT340 takes user-friendliness to a new level, thanks to its well-thought-out design. The device is designed to streamline the inspection process, eliminating the risk of measurement errors due to memory gaps. The emphasis on user-friendliness ensures that operators can navigate the device with ease, improving overall inspection efficiency.
Durability is the cornerstone of the SDT340’s design. Designed to withstand the rigors of industrial environments, the device features an extruded aluminum housing protected by shockproof rubber. This rugged construction ensures that the SDT340 can withstand the bumps and knocks of daily use, providing operators with a reliable tool that stands up to the challenges of the field. For added protection against dust and wear, users can opt for the durable nylon case, which demonstrates the unit’s commitment to longevity and long-lasting performance.
The SDT340’s High Signal Resolution (HSR) feature sets it apart in terms of accuracy. This innovative feature increases sampling rate and sensitivity, enabling users to detect even the most difficult defects with confidence.
The detector in detail
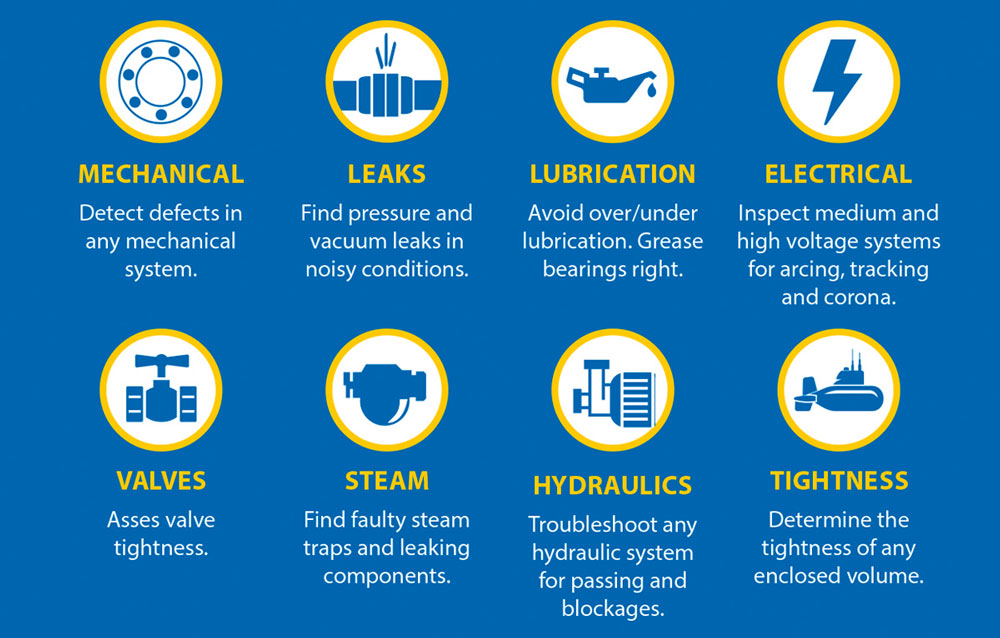
SDT identifies eight areas, “the eight pillars of ultrasound”, in which ultrasound and the SDT340 are essential for ensuring asset reliability:
• Mechanical condition monitoring: Early detection of bearing faults to prevent unexpected failures.
• Bearing lubrication monitoring: Ensure that the right amount of lubricant is applied at the right intervals.
• Compressed air and gas leak detection: Locate leaks to reduce energy consumption and maximize uptime.
• Electrical equipment fault detection: Safe inspection of electrical systems using ultrasound.
• Steam trap testing and maintenance: Keep steam systems clean, safe and energy-efficient.
• Valve condition monitoring: Check that valves are closed properly.
• Hydraulic system monitoring: Detect leaks, bypasses and blockages in hydraulic systems.
• Tightness testing: Ensuring the tightness of enclosed spaces to save energy and money, protect against the elements and respect the environment.
In conclusion, the SDT340 ultrasound detection device is a complete and innovative solution for implementing a predictive maintenance plan and strategy characterized by reliability. Its advanced functions, user-friendly design and commitment to constant improvement make it a valuable tool in the arsenal of those seeking to maintain maximum operational efficiency in industrial environments. The Eight Pillars of Ultrasound highlight the diverse applications of ultrasound technology to ensure the health and longevity of critical assets.
For more information on the SDT340, visit: https://sdtultrasound.com/products/sdt340/

Subscribe to the free Maintworld newsletter here!
Digitalization is Driving Valmet’s Development of Remote Maintenance Services

In recent years, advances in connectivity, big data and digitalization have often promised to bring significant benefits to industry. Now, with the Valmet Industrial Internet, data is being used to deliver a better kind of maintenance service, as well as performance optimization services.
Mika Kari, Global Technology Manager, Valmet Industrial Internet, Board, Paper, and Tissue Solutions, Services Business Line, tells us more. “With the Valmet Industrial Internet (VII), we can offer new types of remote monitoring and optimization services. This is something we can offer globally. We can utilize data from the customer’s site and, using our expertise and analytics, we can turn that data into value. It is a dialogue with data.”
Approaching data with the spirit of expertise
Kari emphasizes that data by itself is not enough. Expertise in the production processes and installed equipment is essential.
“We have developed an advanced digitalization offering that enables us to efficiently and effectively utilize data gathered from installed equipment, which we then use to benefit our customers’ processes and businesses,” Kari says. “Key elements of the VII include Industrial Internet applications, Performance Center, Customer Portal, Intelligent machines and Automation, and a solution ecosystem with leading industry players.

Valmet has an extensive range of VII solutions and applications for maintenance and optimization.
It is important to note that the VII is not just about the technology – it is the combination of human expertise and data analytics that provides the value. Our VII remote services always include remote support from the Performance Center, which is our network of industry and data experts. These are our own people and they have a deep understanding of machinery, processes and automation.”
A better way to serve customers
“Because so much data is available, the trend is now to move from big data to smart data,” says Kari. “There is always a cost for data, so you need to focus on what is relevant. Unnecessary data isn’t worth collecting. That is why Valmet has developed an extensive range of VII maintenance solutions and applications that are targeted at specific aspects of operations, including optimizing and maintaining production capacity, paper quality, energy efficiency and reliability.”

“In practice, when we provide remote maintenance services, what happens is that we securely gather and analyse real-time data with our Performance Center service. Our applications monitor the results constantly for deviations and, if they detect anything, they send an alarm to our Performance Center team. The team will then carry out a deeper analysis, diagnose the issue and identify best options for resolving it. Then they will get in touch with the customer. We have real people – real experts – to help them out.”
Big benefits from remote maintenance
During the pandemic, when international travel was nearly impossible, Valmet was still able to support customers around the world, resolving maintenance issues and even participating in start-ups. All through remote connections.
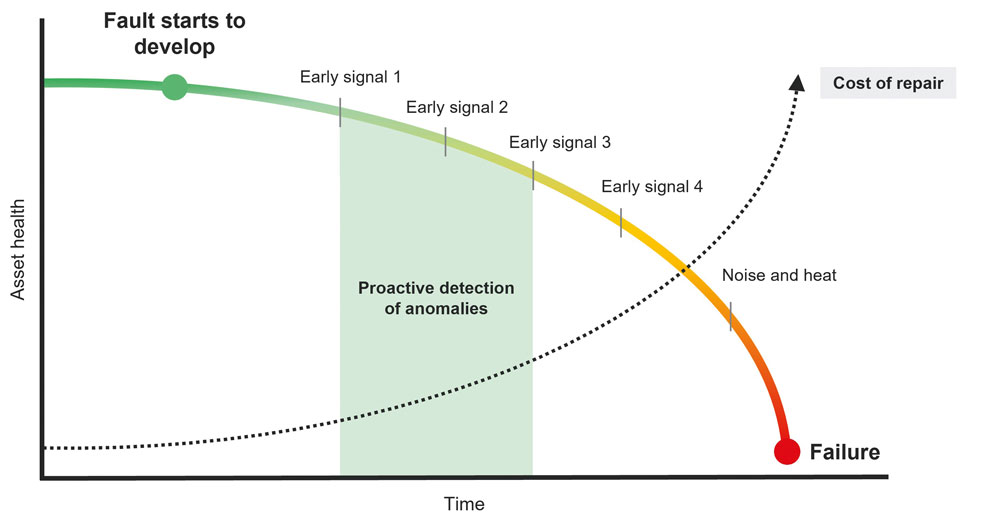
“Remote monitoring and diagnostics enable us to prevent waste,” says Kari. “Whether it is wasted money, travel, time, energy, raw materials, natural resources or emissions. For example, problems in production can lead to poor performance. Now, with continuous monitoring, we can detect issues ahead of time and alert the customer. This kind of proactive, preventive maintenance helps stop the issue from developing and helps avoid waste throughout the value chain.”
“The VII gives us the capability to utilize data from individual process areas or even from a whole plant,” says Mika Kari.
“Because we can provide services remotely, we can also respond faster. The relevant expertise is always available through the Performance Center, so we don’t need to send an expert to the customer’s site and the customer doesn’t need to wait.”
New capabilities turn data into value
As digitalization is increasingly being accepted across industries, it is pushing the development of maintenance forwards.
“The VII gives us the capability to utilize data from individual process areas or even from a whole plant,” says Kari. “For example, our VII offering includes Valmet
Machine Diagnostics, to monitor and optimize the performance of an entire paper or board line. We also have a Valmet Winder Diagnostics service, which specifically focuses on the winder section.”

“Our Performance Center team can do optimization for a wide variety of process applications,” says Kari, “and we can develop VII applications to meet customer’s specific needs. When we analyse data in the right way, we can get insights that enable data-driven decisions. For example, we can determine whether a deviation is a chronic problem or a random incident. If we can identify the root cause, then you do not have to fix the same thing repeatedly. Data can also be used to support our customers’ investment decisions and recommend technical improvements. We are turning data into value for our customers’ businesses.”
Making real progress with maintenance
“The work we have put into developing these remote maintenance services is part of our Beyond Circularity R&D programme and ecosystem, which is a four-year programme that is partly funded by Business Finland,” adds Kari. “So far, our customers have appreciated our ability to help them quickly and remotely, and we have been introducing remote training, which will become more important with younger generations. Valmet recently attended Technology Fair 2023 in Helsinki, Finland, where we won the Finnish Maintenance Society’s innovation prize for our success with Valmet Industrial Internet, Remote Monitoring and Optimization. We are delighted with this! It shows that we are really making progress.”
Text: Peter Cura
Images: VALMET
Subscribe to the free Maintworld newsletter here!
Ensuring a Safe Work Policy Through Proper Follow-up on the Job and Improvement in the Field

The focus on safe working is increasing. In addition to preventing economic, environmental and image damage, the human factor is becoming increasingly important. Awareness of working safely is high. Zero incidents is always and everywhere the goal, but actually securing this on the shop floor is unfortunately not always well organized.
The structured implementation of safety in the organisation starts with identifying the risks. For complex and also standard maintenance work, a Task Risk Analysis (TRA) must be carried out to ensure safe working. What are the risks and what mitigating measures can we implement to improve this?
Mitigate risks
Up-to-date asset data is a pre-requisite for developing effective risk mitigation measures on site. You must be able to rely on the actual information. But it is not a given. It regularly comes to light that the asset data and drawings are not up to date and not representing the actual situation in the field. The transfer of new data and its processing in the Enterprise Asset
Management (EAM) system is often a complicated process and often delivered too late. Incomplete ‘Management of Change’ is also regularly a cause of the lack of the latest updates.
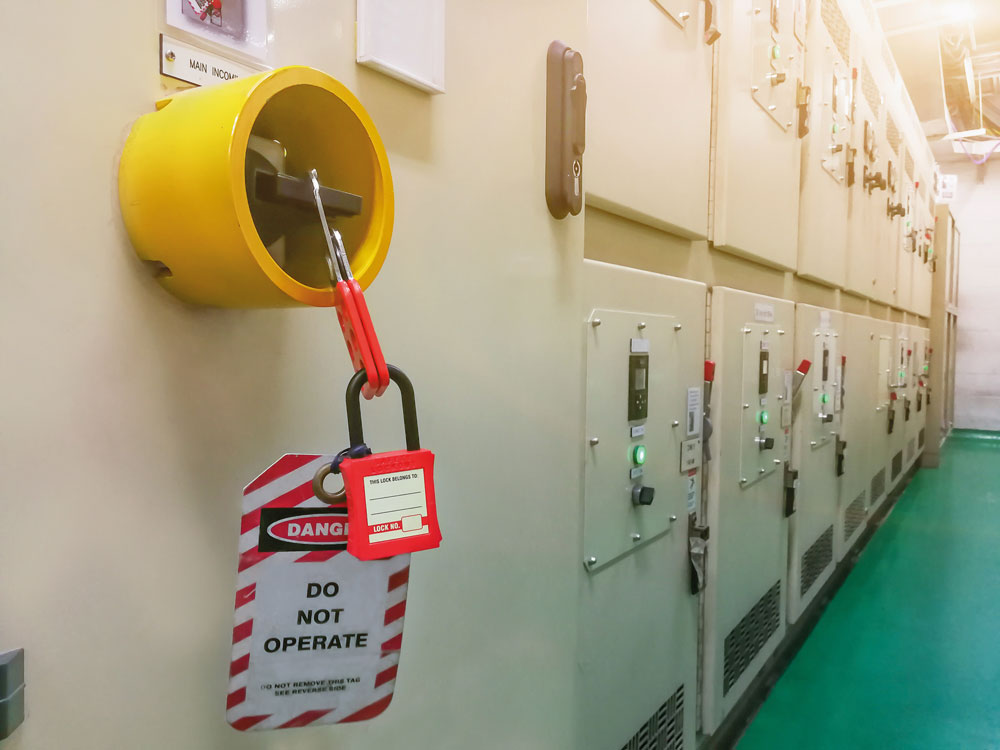
So who knows what the latest version is for a proper ‘lock-out, tag-out, try-out procedure’ (LOTOTO)? And has asset coding in the field been updated? Simplification of processes and complete transfer of requested information deserves attention.
Ensuring safety
Ensuring safe working practices begins with work preparation. Assessing risks in advance and determining additional measures are important steps. On-site inspections and a task-risk analysis for more risky and complex work are necessary. Often shortcuts are made because of time pressure or lack of resources.
Most companies have LOTOTO procedures and work permits to ensure safety in place. The crux is proper handover and follow them in practice. An excess of “paper” detracts from the essentials and misses the point in handing over to the implementers.
Daily handover and supervision by an on-site supervisor or foreman are crucial to ensure that an LMRA (Last Minute Risk Analysis) is performed on the job site with production and performers. After all, are the risks and potential consequences really discussed in advance and are the right measures taken? In practice, boxes are often checked off too quickly.
After completion, the works performed must be delivered, monitored and evaluated. In practice, too little capacity is usually scheduled for this, so field checks are only partially done. Nevertheless, checking that the plant is effectively closed and working properly again will prevent new leaks or a failing startup. Close the Plan-Do-Check-Act circle.
Improve continuously
The final step to ensure continuous improvement on this matter: continuously look for simplification of procedures, such as the use of digital work permits. Conduct regular evaluations for improvement and involve the contractor, as an equal partner.
Lately, the shortage of experienced performers is increasing, and non-native speakers are being used more frequently. Preliminary discussions, targeted Toolbox Meetings, language proficiency checks and digital work packages with more visual information and less text have become a must. The manager should start the conversation on the shop floor. What causes someone to experience time pressure? Why did someone deviate from procedure? Was the transfer clear? Identify the real problem and stop work if performers prove insufficiently capable or do not keep appointments.
In short, show that you take safety seriously, that policies are consistently implemented. That way you create a culture where you alert each other and can be open about improvements. In doing so, you may have prevented the next incident.
Text and images: Laura van der Linde, Mainnovation
Subscribe to the free Maintworld newsletter here!
A Route to Enhanced Energy Efficiency With Energy Eudits

Erich Labuda, President of Motion Services at ABB, explains how maintenance professionals can improve energy efficiency based on data collected from energy audits.
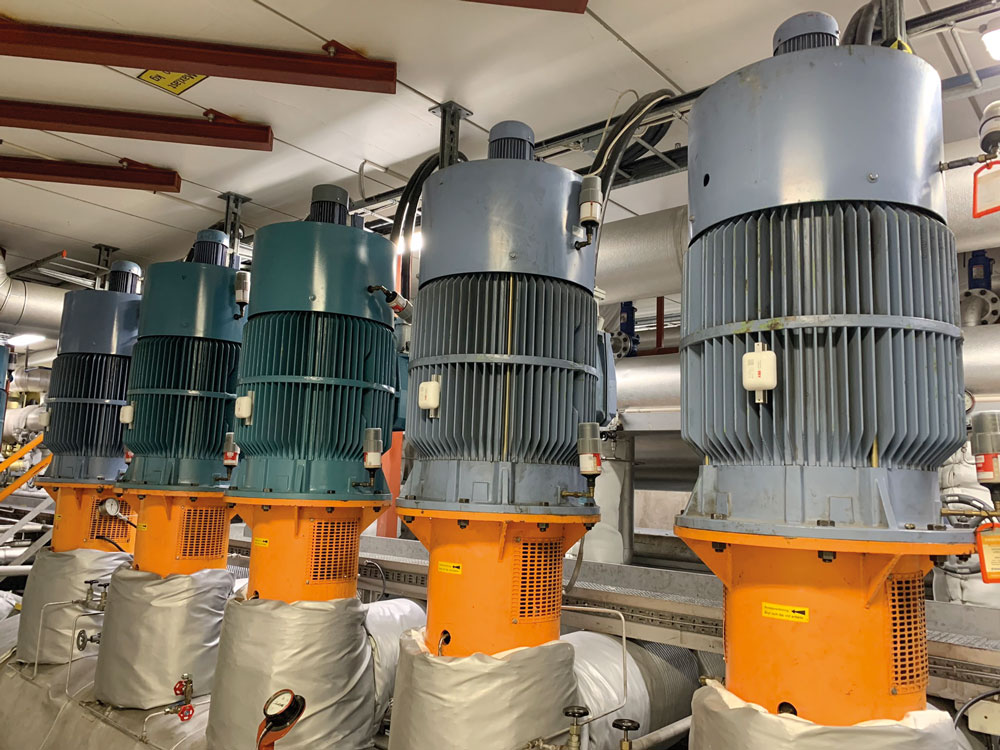
If there is one thing that truly powers industry, it is motors. They are everywhere, for example, helping pump clean water and power heating, running ventilation, and air conditioning (HVAC) systems etc. There are more than 300 million industrial electric motors in operation currently around the world and, according to the International Energy Agency (IEA), they consume nearly half of all globally produced electricity.
Increasingly, as we move away from fossil fuels, green energy will be used to power these motors. However, it will take a lot of time and money to fully develop the infrastructure required for this transition to renewables.
With the 1.5°C global warming target approaching, a more immediate solution is to reduce energy consumption by making motors more efficient – which also cuts energy costs. This falls in line with the IEA’s prediction that if we are to meet Net Zero by 2050, a third of all emissions reductions need to come from energy efficiency. The IEA has also said that replacing all motors and drives with high-efficiency upgrades would reduce global electricity consumption by at least 10 percent.
Energy audits hold the key to energy efficiency
Businesses are keen to improve their energy efficiency, but they often don’t know where to start. An ABB survey found that, while 97 percent of industry leaders actively want to invest in making their operations more energy efficient, only 41 percent know how to go about it.
Businesses are keen to improve their energy efficiency, but they often don’t know where to start
That is why energy audits are so useful. They tell precisely where the biggest efficiencies can be found across hundreds of motor systems in a plant or facility. This helps maintenance teams make better decisions on how to save energy and cut costs, by targeting motors with the greatest energy-saving potential.

Data can be gathered in various ways: manually, with an expert visiting a site, or digitally with data gathered remotely for regular energy-use updates. With this operational data, an expert can analyse the motor system’s current performance against its potential performance if it were upgraded or resized, for example. The energy savings and emissions avoidance that might be achieved can then be calculated, as well as the projected return on investment (ROI).
The audit itself can be carried out without any impact on a facility’s operations. A plan can be developed to roll-out efficiency improvements in the least disruptive way while maximizing ROI. For example, upgrades can be done in line with routine maintenance schedules to minimize downtime.
Audits in action
A typical way to improve the energy efficiency of the system might include adding a variable speed drive (VSD) to a motor. VSDs enable operators to adjust the speed or torque of a motor in line with the demands of the task. By doing so, they cut energy consumption and bills – reducing a motor’s speed by just 20 percent reduces energy use by 50 percent. Surprisingly, at least half of all industrial electric motors would benefit from VSDs, but only a quarter use them.
Another way to boost energy efficiency is by upgrading to more efficient motors. Many motors in action today rely on outdated IE1 or IE2 technology (where an increasing IE rating indicates greater efficiency). However, modern motors can reach IE5 levels of efficiency, which offer 40% lower energy losses compared to IE3 motors, leading to lower energy consumption and less CO₂ emissions.
Another common finding of energy audits is that many motors are oversized and that resizing them will optimize energy efficiency without impacting reliability. Take an HVAC motor as an example. They are often specified to operate at a maximum load way above the average. For example, they might be engineered to deal with 40°C external temperatures, but that might only occur a few days a year. In addition, system specifiers tend to add a “safety margin” at each stage, which isn’t always necessary and decreases energy efficiency.
That is why it is important to not just evaluate motor efficiency, but the system as a whole. Using the HVAC example, this would also include the fans, condensers and cooling towers. This holistic approach improves overall energy efficiency.
Surprisingly, at least half of all industrial electric motors would benefit from VSDs, but only a quarter use them.
For an example of what an energy audit can do, take the Swedish flooring manufacturer, Tarkett. When the company had an energy audit in 2022, it found that upgrading 10 of its motors to more efficient synchronous reluctance technology (SynRM) with VSDs would boost efficiency from 80 to 95 percent. With these changes in place, it was forecast that Tarkett could save around 800 megawatt-hours (MWh) per year, or the equivalent of charging every German’s smartphone – all 68 million of them. The expected payback period for making these upgrades was just 18 months or less, according to the energy prices at the time.
Identifying efficiencies around the world
To show the true power of energy audits in identifying energy savings, we recently audited more than 2,000 industrial motors across a wide range of sectors and applications. We found potential energy savings of 31 percent per motor if they were upgraded to more efficient technology. The highest savings typically came from motors operating without a VSD. If the suggested upgrades from each audit were implemented, a return on investment (ROI) in as little as three months could be achieved, depending on the local cost of energy.
The audits identified a total of 2.1 terawatt-hours (TWh) of savings over the 20-year lifespan of the 2,000 motors. In other words, enough energy to power 1.25 million houses – the size of a large city – for a full year.
The audits were conducted across a variety of countries. However, if we imagine that all motors were operating in the UAE, based on November 2023 data, a 2.1 TWh energy saving would avoid 1.5 million tonnes of CO2 emissions and have an ROI of six months. Equally, if they were in Germany, savings would amount to 940,000 tonnes of CO2 and an ROI of just three months. These savings would be enough to offset the emissions of a coal plant for three months in the UAE and two months in Germany.
By scaling up these results to cover the 300 million industrial motors operating worldwide, you can start to imagine the potential impact of upgrading inefficient motors all over the planet.
The solution is clear, then. It is time we increase energy efficiency to cut costs and emissions. Energy audits streamline the process by highlighting the best places to make those efficiency improvements, representing a straightforward way to meet Net Zero targets.
Text: Erich Labuda Images: ABB
Subscribe to the free Maintworld newsletter here!
Determining the Lubrication Condition of a Sliding Bearing Using Acoustic Emission and Data-Based Classification
VTT has participated in the EU-funded and Spanish IKERLAN-coordinated INNTERESTING research project.
Sliding bearings are the oldest known bearing solutions. As the power density of machines and components increases, efforts are being made to reduce the space occupied by rolling bearings, making sliding bearings an interesting alternative. For the useful life of sliding bearings, it is important that the bearing lubrication mode is hydrodynamic (HD) or elastohydrodynamic (EHD), and there are no mechanical contacts between the shaft and bearing surfaces. Mechanical contacts between the surfaces leads to mixed lubrication (ML) and potentially to boundary lubrication (BL), which can lead to wear and destruction of the surfaces. The load-carrying capacity of the lubricating film is affected not only by the dimensions, surface quality, rotational speed, and load but also by the pressure, viscosity, and the temperature of the lubricant.
Interesting research project
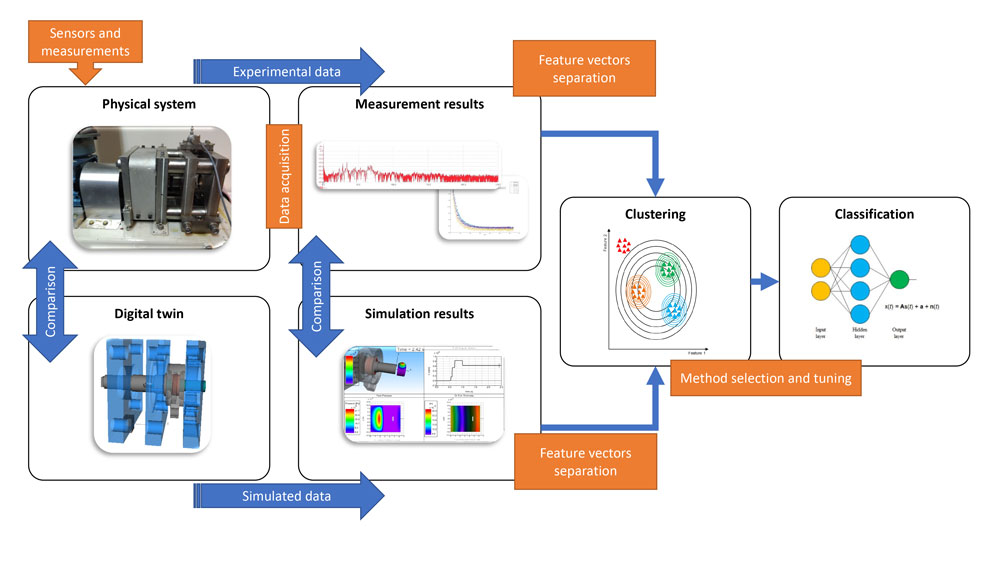
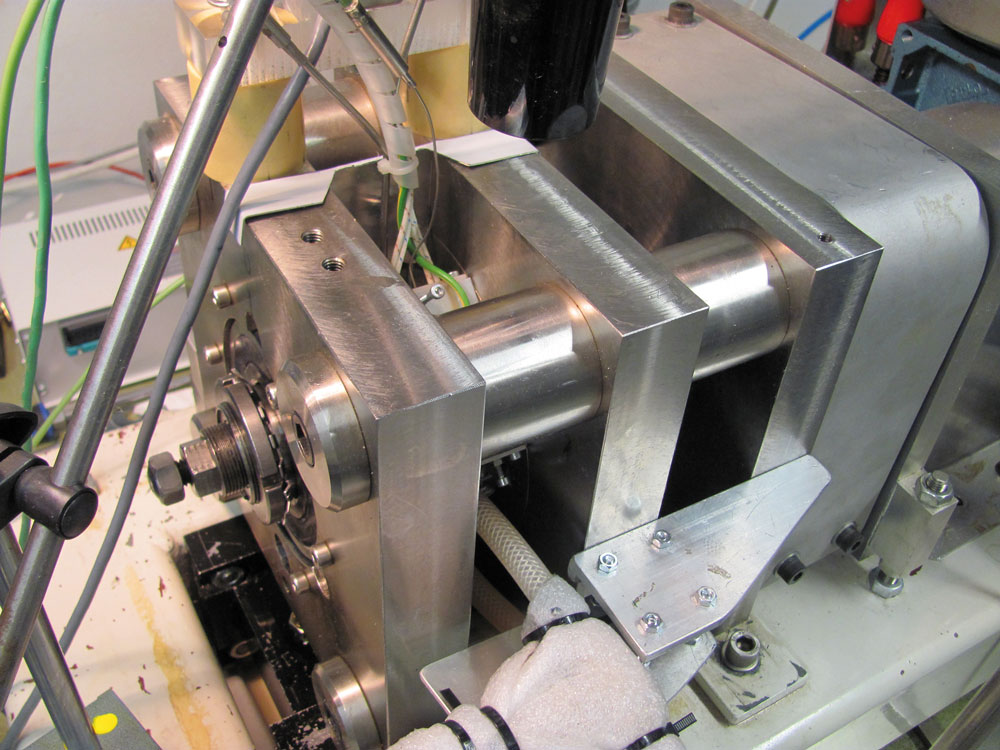
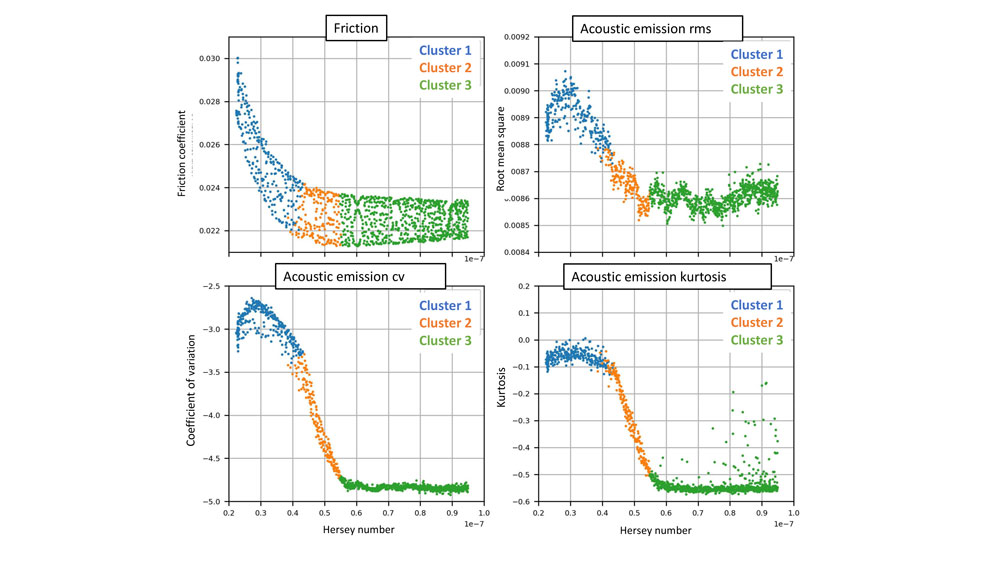
VTT has participated in the EU-funded and Spanish IKERLAN-coordinated INNTERESTING research project ( https://doi.org/10.3030/851245 ). In this project VTT has developed, among other things, the data-based classification method (Figure 1) for observing the operation of a hydrodynamic bearing, the prevailing lubrication situation, as well as the disturbances and abnormal operational conditions. In the experimental study, a hydrodynamic bearing test device designed and built by VTT (Figure 2) was utilized, where the bearing and shaft are interchangeable, and the materials can be selected according to each specific investigation. In the experiments, the torque caused by sliding friction on the bearing was measured in relation to the load and sliding speed.
Measurement data and simulated virtual data were utilized to create a data-driven hybrid model.
Measurement of friction in a journal bearing is a relatively unsensitive method for detecting changes in lubrication conditions. Therefore, the hydrodynamic bearing test device was equipped with a sensitive acoustic emission (AE) sensor to measure the intensity and quantity of elastic waves caused by mechanical interactions. By utilizing a broadband AE sensor, information about variations in the frequency content of the elastic waves was also obtained. AE measurements have previously been used, for example, in the detection of fatigue damage, but recent research results have shown that even the contact and elastic yielding of microscopic surface roughness aperities on the bearing surfaces can cause measurable acoustic emission. By exploiting this phenomenon, changes occurring in the lubrication conditions of the hydrodynamic bearing can be observed.
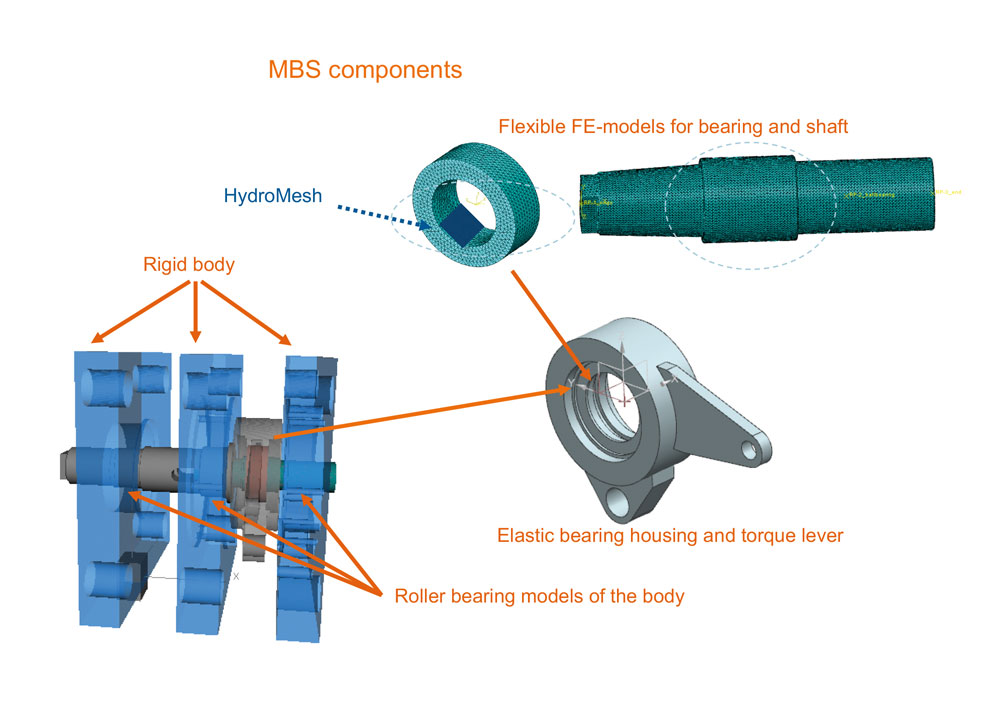
In the study, the digital twin of a journal bearing test rig was utilized by creating a multi-body simulation model (MBS) using Dassault Systemes/Simpack software. The model included elastic element models (FEM-based models) of key components (Figure 4), as well as the lubrication situation of the journal bearing modeled using HD and EHD models. The validation and sensitivity analysis of the simulation model was performed by comparing the simulation results with experimental results. By utilizing both experimental data and virtual representation, information about the pressure and thickness of the lubricant film, as well as indications of contacting between bearing surfaces, can be obtained. By combining simulated and experimental data, a comprehensive understanding of the friction behaviour of the lubricated journal bearing is obtained up to the boundary lubrication situation.
Data-based classification
Measurement data and simulated virtual data were utilized to create a data-driven hybrid model (Figure 1) that can determine the lubrication situation of the journal bearing as the operating conditions change. Mean shift clustering algorithm was employed in the modeling to divide the measured data into different clusters or groups. The goal was to find calculated features from the experimental data that could serve as a basis for forming the clusters based on the lubrication situation.
The selected features were calculated from the acoustic emission (AE) data, based on previous studies and available experimental data. The selected features were as follows:
• Kurtosis is a measure of distribution tailedness. The high kurtosis indicates a high number of outliers. Kurtosis is a well-known parameter in vibration signal analysis in the field of condition monitoring.
• The coefficient of variation is a statistical measure used to assess the relative variability of a data set. It is calculated as the ratio of the standard deviation to the mean.
• The root mean square (RMS) of AE signal is applied to measure the magnitude of a fluctuating quantity, e.g., vibration levels in mechanical systems. It is calculated by taking the square root of the mean of the squared values of a set of data.
• The dimensionless Hersey number is a function of viscosity, rotational speed, load, and the dimensions of the bearing. This term is used in the study and analysis of lubrication and lubricants, particularly in relation to the performance and efficiency of bearings. It can be used for determining the lubrication requirements and characteristics needed for optimal bearing operation.
When referring to friction, the root mean square of friction provides a measure of the average frictional force acting on an object. It considers both the magnitude and direction of the frictional forces experienced by the object.
The developed hybrid method enables in situ monitoring of the lubrication mode of the hydrodynamic bearing (Figure 5). Similar type of development work has been carried out in multiple locations in recent years, for example, Mokhtari et al. (2020), as well as König et al. (2021).
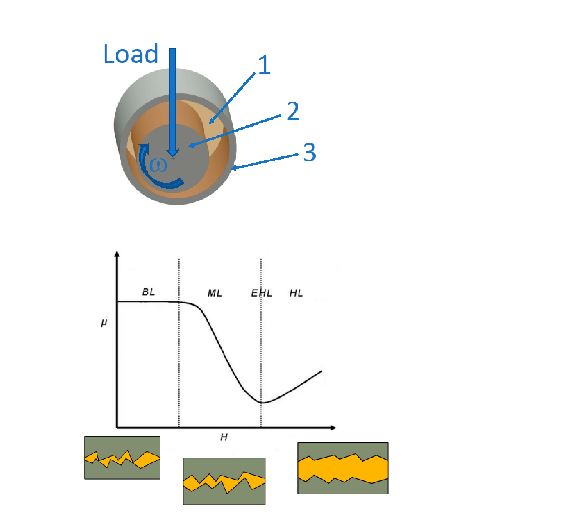
Deal operating range of a sliding bearing
In a plain bearing, the load is carried by a lubricant film that forms between the rotating shaft and the bearing (Figure 3). The pressure within the lubricant film, which differs from the supply pressure of the lubricant, and the thickness of the lubricant film (h) are the most important parameters describing the operating conditions of hydrodynamic sliding bearings. The hydrodynamic lubrication (HD) situation prevails when the lubricant film completely separates the bearing surfaces. In elastohydrodynamic (EHD) lubrication, the lubricant film also separates the bearing surfaces, but as the contact pressure increases, the bearing surfaces undergo elastic deformations. When the lubricant film thickness decreases, there are contacts between the bearing surfaces in addition to fluid lubrication, leading to a mixed lubrication (ML) situation. When the contacts between the bearing surfaces dominate, a boundary lubrication (BL) situation occurs. The ideal operating range for a sliding bearing is within the hydrodynamic lubrication zone, where friction is low. As the operating conditions change to mixed lubrication and further to boundary lubrication, friction increases and the wear and damage of the bearing surfaces become possible. Typically, boundary and mixed lubrication situations occur during the startup and shutdown of equipment, but for many devices, these conditions can also occur during actual operation at low speeds.
Acoustic emission
Acoustic emission refers to the propagation of transient elastic waves in a material, caused by rapid energy release in localized point or points. Since acoustic emission is the motion of sound waves, the propagation of acoustic emission in a material can be described using the equations of normal elasticity theory. Acoustic emission can be caused by various phenomena occurring in the material or external impact-like excitations on the material. These phenomena may include phase transformations in certain metals causing mechanical stresses, crack growth or plastic deformation, and contacts between surfaces in lubricated systems, for example. The detection of acoustic emission, i.e., the intensity of the signal, depends on the type of wave, the medium being measured, and the reflection caused by interfaces. Knowledge of special mounting solutions for installing sensors that measure acoustic emission is required, as well as understanding the effect of the sensor and the measurement method used on the measured signal. Acoustic emission is normally measured in the frequency range of 50 kHz to 1 MHz, depending on the type of sensor. Various quantities can be calculated from the signals, which can be used to characterize the phenomena. With a wideband sensor and an efficient measurement card, it is possible to detect deviations and phenomena also in terms of frequency. It is also possible to measure at lower frequencies, but in this case, the increasing impurity of the signals naturally leads to a stronger need for filtering.
Artificial intelligence
Artificial intelligence has been applied for the diagnosis of machine condition for decades, and the number of applications has been growing rapidly recently. The goal of classifying or clustering data into classes or clusters is to maximize the similarity of data points within the same class or cluster, and, on the other hand, minimize the similarity between different classes or clusters. The key difference between classification and clustering methods is the supervision of learning (supervised or unsupervised learning). If the location of data samples within a specific lubrication interval on the Stribeck curve is known, supervised learning methods could be utilized. In the present study there are no clear boundaries between lubrication regimes and, thus, unsupervised machine learning, has been employed to distinguish data clusters. The most common clustering methods can be categorized into centroid-based, density-based, distribution-based, and hierarchical methods. The commonly mentioned clustering method in learning materials, K-means, belongs to the centroid-based methods. It aims to partition the data into a predetermined number of clusters (k). The method chosen for this work is Mean Shift Clustering (MSC) since the Stribeck curve forms a continuum of lubrication intervals that are difficult to separate. MSC was able to achieve data segmentation with the least amount of information in this case. MSC also belongs to the centroid-based methods, where each data point converges towards the centroid of its cluster by iterating the mean-shift function. The selection of the kernel size/bandwidth of the mean-shift function affects the number of clusters (centroids) and must be done with care. Therefore, a good result cannot be completely achieved purely through machine computation.

VTT Technical Research Centre of Finland Ltd is a Finnish, fully state-owned limited liability company. The special duty of VTT as an independent and impartial research centre is to promote the wide-ranging utilisation and commercialisation of research and technology in commerce and society.
SOURCES:
• Eitzen, D., Wadley, H., Acoustic Emission: Establishing the Fundamentals. Journal of Research of the National Bureau of Standards, Vol. 89, No.1, January-February 1984, pp. 75 – 100.
• Fukunaga, K., Hostetler, L., The estimation of the gradient of a density function, with applications in pattern recognition. IEEE Transactions on Information Theory, vol. 21 (1975), no. 1, ss. 32-40. https://doi.org/10.1109/TIT.1975.1055330
• Halme, J., Parikka, R., Tervo, J., Akustinen emissio ja sen kaytto koneiden ja laitteiden monitoroinnissa ja diagnostiikassa. Julkinen tutkimusraportti BVAL73-001063, VTT, 2001. 28 s.
• Konig, F., Marnheineke, J., Jacobs. G., Sous, C., Zuo, Ming, J., Tian, Z., Data-driven wear monitoring for sliding bearings using acoustic emission signals and long short-term memory neural networks. Wear, Vol 476 (2021), pp. 203616 – 1-7. https://doi.org/10.1016/j.wear.2021.203616
• Mokhtari, N., Pelham, J., Nowoisky, S., Bote-Garcia, J-L, Guhmann, C., Friction and Wear Monitoring Methods for Journal Bearings of Geared Turbofans Based on Acoustic Emission Signals and Machine Learning. Lubricants 2020, 8, 29; https://doi:10.3390/lubricants8030029
• Sato, I., Rotating Machinery Diagnosis with AcousticEmission Techniques. Electrical Engineering in Japan, Vol 110(1990), No. 2, ss. 115 – 127.
• Tribonet, https://www.tribonet.org/wiki/journal-bearing/.
Acknowledgements
The work was carried out in the INNTERESTING
(Innovative Future-Proof Testing Methods for Reliable Critical Components in Wind Turbines)project that received funding from the European Union’s Horizon 2020 –Research and Innovation Framework Programme (2014-2020) in the call H2020-LC-SC3-2019-RES under grant agreement No. 851245.
www.innterestingproject.eu
Jyrki Tervo, Jukka Junttila, Mikko Savolainen, Artur Korostavyi, Helena Ronkainen,
Juha Virtanen (VTT) Ville Lämsä (DIMECC OY)
Subscribe to the free Maintworld newsletter here!
The Augmented Revolution: The Harmony of Humans, Robots, and AI in Maintenance 5.0

The Harmony of Humans, Robots, and AI in Maintenance 5.0
Officially introduced by the European Union in 2021, Industry 5.0 takes a holistic approach that integrates certain core values. While Industry 4.0 predominantly focused on connectivity, automation, and data-driven intelligence, Industry 5.0 introduces a paradigm where technology converges with a renewed emphasis on human-centric values. This evolution underscores the importance of collaboration, sustainability, and the integration of human skills. In essence, Industry 5.0 seeks to strike a balance between technological innovation and human values. The collaborative interaction between humans and machines takes centre stage, fostering a work environment where technology complements and augments human capabilities. This transition reflects a broader understanding of the role of technology in enhancing overall well-being, sustainability, and the collaborative spirit within the industrial ecosystem.
Wall-E and Eve – Circularity, sustainability and hope for the future
WALL-E, a 2008 animated masterpiece produced by Pixar, explores themes that resonate with contemporary challenges and as such, offers useful advice to today’s industry. It introduces a dystopian future where, as a result of global warming, Earth is overwhelmed by waste and pollution. The film is also a powerful commentary on the relationship between humans and technology. The characters of WALL-E and EVE, two robots with distinct personalities, serve as more than animated entities; they embody deeper meanings about technology and its impact on society.
WALL-E, the last functioning waste-collecting robot, represents resilience and the potential for renewal. His daily routine of compacting garbage echoes the cyclical nature of environmental management, showcasing the need for sustainable practices. EVE, an advanced robot sent to Earth from the spaceship Axiom, symbolizes hope and the possibility of positive change. Her directive to find signs of life aligns with the film’s underlying message of environmental stewardship. The connection between WALL-E and EVE transcends robotic programming, emphasizing the importance of genuine human connections even in a technologically dominated world.
WALL-E’s dystopia is no longer an imagined and unlikely possibility.
The film prompts viewers to reflect on the consequences of dehumanization caused by excessive reliance on technology. In contrast to the robots, the humans aboard Axiom become lethargic, glued to screens and disconnected from their surroundings. Thus, WALL-E warns against the potential erosion of essential human qualities in a hyper-technological society. Ultimately, the film raises crucial questions about striking a balance between technological progress and human connection. It advocates for the preservation of our environment and the nurturing of relationships that define our humanity. The film’s dystopian portrayal of a future marred by technological excess is a cautionary tale, urging us to reconsider our trajectory and make informed choices for the well-being of our planet and society.

Industry 5.0 – Choosing the right direction
WALL-E’s dystopia is no longer an imagined and unlikely possibility. Climate change is a reality, and fears about an uncertain future have been exacerbated by the global pandemic. Technology is inexorably advancing, but at the same time, a fear of technology associated with the concept of the “dark factory” is emerging. In this scenario, complete automation will eliminate humans, and production and maintenance operators will disappear, causing many to fear that technology has not been managed properly. Industry finds itself at a crossroads – the previous focus was solely on performance and profit, neglecting aspects such as sustainability, humanity, and climate change, all of which are crucial today. It must find a new direction.
This is where the call for Industry 5.0 emerged, driven by the European Commission and embraced by most EU members. Industry 5.0 redefines the industrial perspective, imposing limits on Industry 4.0 by emphasizing three fundamental aspects. First, industry must coexist with humans, recognizing the importance of the human factor in the industrial equation. Second, industry must be sustainable, considering environmental aspects and energy conservation. Third, industry must be resilient, considering the fragility revealed by events such as the COVID-19 pandemic.
In Industry 5.0, AI will coexist with humans in a human-centred manner.
The transition to Industry 5.0 involves humanizing technology, reintegrating humans into the production process, and ensuring environmental sustainability. In this revised understanding, AI will coexist with humans in a human-centred manner. This transformation implies a radical shift in the role of AI, moving from the removal of human decisions to the creation of a transparent and collaborative coexistence.
From autonomous robots to augmentation
Robots will play a significant role as we move from Maintenance 4.0 to Maintenance 5.0. The COVID-19 pandemic revealed human fragility. We need versatile robots capable of performing maintenance tasks in tough situations. However, Industry 5.0 emphasizes technology should not overpower humans; humans must always remain at the centre of the equation.
In this context, various types of robots are envisioned for maintenance tasks, including cobots (collaborative robots) that perform tasks similar to humans, working collaboratively with them. The idea is that robots should facilitate and collaborate with humans, ensuring humans are integral to the decision-making process, especially in extreme situations, but should never replace and eliminate them.
This collaboration will transform the way we perform maintenance, as robots and humans together will sum up to skills never seen before. Future machines will be designed for maintenance in a different way, with mixes of humans and cobots working together seamlessly. This will include exoskeletons that enhance human capabilities physically and mentally, remote operations using virtual and augmented reality, and robots operating similarly to humans.
A Collaborative approach – Humans and robots working together
The message is clear in the famous movie Robocop where the evolution of law enforcement technology witnesses a pivotal moment with the introduction of ED-209 (Robocop predecessor), designed to be the friendly face of neighbourhood policing. During its first demonstration, a disastrous malfunction leads to chaos and gives the green light to the RoboCop programme. The incident marks a turning point, highlighting the limitations of full robotic law enforcement. In the movie, the transition from fully autonomous robots, ED-209, to a mix of humanoid robots becomes imperative.

Equipped with three automatic cannons, an auto-shotgun, and a rocket launcher, ED-209 showcases the potential of robotic assistance but also highlights weaknesses in logic circuits and adaptability to complex environments. A critical vulnerability emerges, as skilled hackers, exemplified by Nikko Halloran, have the ability to override and control ED-209 through strategic port bypassing. This indicates the need for a new approach to law enforcement technology, one that embraces a mix of humanoid robots and advanced technology.
The journey from ED-209’s malfunction to its manual override weakness emphasizes the importance of integrating human-like adaptability with robotic precision, both in the film’s law enforcement scenario and in today’s industrial landscape. This vision for the future involves a collaborative approach, where humanoid robots coexist with humans, combining the strengths of both to create a more resilient and adaptable system. The shift represents a strategic move towards a balanced and effective future, where the capabilities of machines and the unique problem-solving abilities of humans complement each other seamlessly.
Augmented maintenance decisions
The Star Wars prequels also offer useful insights into the evolution of industrial technology. George Lucas’ thematic exploration of nature versus technology, symbolized in the visual contrast between clones and droids, extends beyond the cinematic narrative to a discourse on the benefits of augmented humans in the industrial landscape. For example, the dehumanizing representation of Trade Federation battle droids underscores the potential pitfalls of complete automation in industrial processes, while the subsequent integration of clones as workers introduces a nuanced interplay of technological prowess and ethical considerations.
From a technical standpoint, the Republic’s preference for clones over droids reveals a tension between expediency and ethical considerations. The Clone Army, equipped and logistically supported, provides a rapid and task-ready solution without the need for the establishment of fully automated systems. This reflects contemporary discussions in industrial circles on the efficiency and ethical implications of deploying advanced technologies in manufacturing and production. The unforeseen consequences of the Republic’s reliance on clones, similar to the unintended ramifications of advanced technologies in industry, come to light, as the clones showcase autonomy, creativity, and adaptability in their roles. This narrative prompts a technical exploration of the delicate balance required in harnessing the power of augmented humans for industrial applications.
AI support, reshaping the landscape of equipment management
In the cosmic allegory of Star Wars, the Republic’s preference for clones becomes a technical narrative emphasizing the advantages of augmented humans over fully automated systems in the industrial field. The parallels between the technical capabilities of augmented beings, showcased by the clones, and the ethical considerations inherent in their deployment, serve as a technical roadmap for our own journey through the evolving landscape of industrial technology. In augmented decision-making in the real world envisioned by Industry 5.0, human maintenance crews will be supported by AI, thus reshaping the landscape of equipment management, troubleshooting, and repair processes. This symbiotic relationship between human expertise and AI-driven insights represents a paradigm shift, offering a multitude of advantages over traditional approaches and stand-alone AI systems.

In a manufacturing environment, for instance, maintenance crews equipped with augmented decision-making capabilities will integrate AI into their workflow. When faced with equipment malfunctions, the crews will utilize AI algorithms to rapidly analyse historical performance data, identify potential failure patterns, and predict impending issues. This will expedite the diagnostic phase and allow proactive maintenance interventions, minimizing downtime and optimizing overall equipment effectiveness.
The adaptability inherent in augmented decision-making will be particularly beneficial in dynamic industrial settings. Human maintenance professionals, leveraging their experience and contextual understanding, will collaborate with AI to address intricate challenges. Unlike rigid AI systems that may struggle with nuanced scenarios, the combination of human intuition and AI analytics will result in nuanced and contextually aware decision-making. For instance, when determining whether to repair or replace a component, crews can factor in long-term implications, cost-effectiveness, and real-time operational demands.
In essence, augmented decision-making will transform maintenance crews into highly efficient and adaptive teams. They will be empowered by AI-driven insights that streamline processes, enhance diagnostic accuracy, and foster a proactive approach to equipment upkeep.
As we usher in an era of technological synergy, maintenance stands to benefit significantly from the augmented capabilities that blend human expertise with the analytical
The integration of humans, robots, and AI will transcend the limitations of traditional maintenance.
prowess of AI. This collaborative evolution will pave the way for a future where maintenance operations are not only more efficient and reliable but also more attuned to the intricate demands of industrial ecosystems.
Augmented reality, metaverse and remote troubleshooting
In the envisioned future of cohabitation between humans, robots, and AI, the integration of digital twins, metaverse, and augmented reality will be a transformative force in remote asset maintenance. Maintainers, regardless of their geographical location, will be able to immerse themselves in assets using augmented reality, thereby revolutionizing the approach to troubleshooting by combining robotics with human advisory roles.
In the movie Surrogates, starring Bruce Willis, individuals navigate the physical world through robotic avatars. The augmented reality and digital twin scenario of Industry 5.0 unfolds as a real-world manifestation of this imagined synergy. In this scenario, maintainers will gain the ability to virtually step into assets, diagnose issues, and guide robotic interventions, all accomplished from a considerable distance. The collaborative synergy among humans, robots, and AI in this immersive maintenance paradigm will not only amplify operational efficiency but also introduce a dimension of interconnected collaboration. The conventional boundaries between the physical and virtual realms will dissolve, ushering in an era of unmanned, collaborative, and seamlessly integrated maintenance operations, akin to the futuristic landscapes of the science fiction narratives mentioned here. In this envisioned future, maintenance operations link human expertise, robotic precision, and artificial intelligence insights. The once-distinct realms of physical and virtual will cease to be separate entities, converging into a unified landscape where human controllers, robots, and AI collaborate to ensure optimal functionality and efficiency.
The dissolution of conventional boundaries implies that maintenance professionals can transcend geographical limitations, immersing themselves in the assets they oversee through augmented reality interfaces. The interconnected collaboration will unfold as a dynamic interplay of strengths, where human intuition and adaptability will combine with the precision and automation capabilities of robots. The result will be an unmanned and collaborative maintenance approach that redefines industry standards.
Humans, robots and AI together – transcending limitations
The integration of humans, robots, and AI will transcend the limitations of traditional maintenance. In effect, human controllers will be the orchestrators of the maintenance process, leveraging their expertise to make nuanced decisions, whilst relying on their robotic counterparts for physical interventions. Meanwhile, AI will analyse data, provide real-time insights, and continuously learn from human interactions to enhance its decision-making prowess, thus becoming the conductor of the maintenance process, harmonizing the efforts of humans and robots and ensuring efficiency and reliability in asset management. Ultimately, as Industry 5.0 becomes a reality, maintenance operations will no longer be bound by physical proximity, assets across the globe will be managed with precision, and the synergy between human intelligence and technological prowess will create a new standard for collaborative efficiency.
Text: Prof. DIEGO GALAR / Prof. RAMIN KARIM / Prof. UDAY KUMAR Images: ShutterStock, Freepik
Subscribe to the free Maintworld newsletter here!
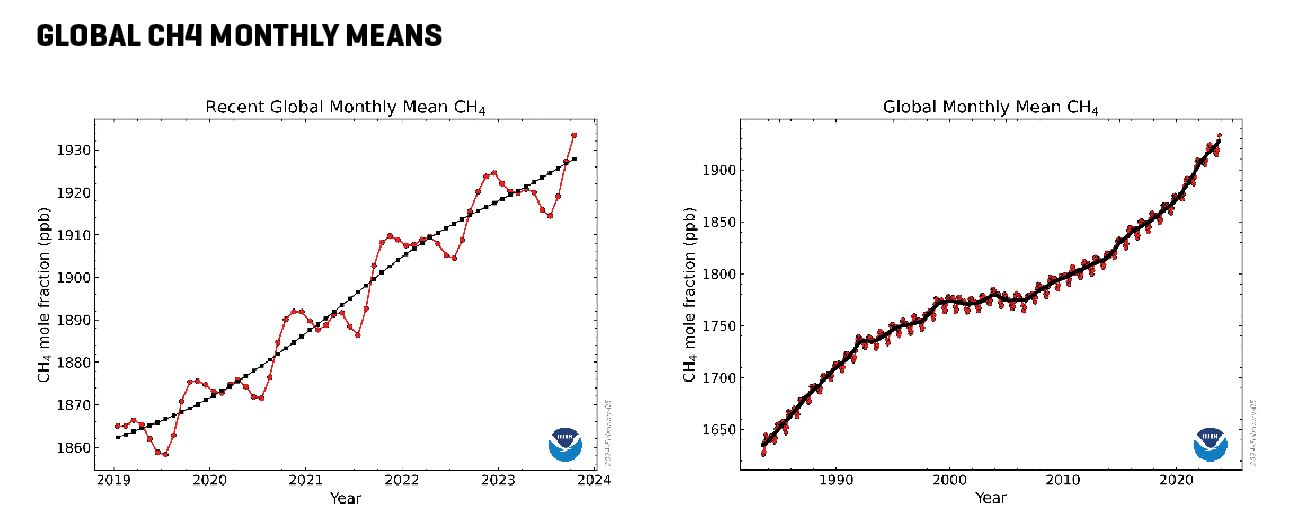
Will 2024 be the Year the World Wakes up to Methane Emissions?

As the world grapples with the looming threat of methane emissions, the fossil fuel industry is finally starting to wake up.
More than 150 countries have signed the The Global Methane Pledge, committing them to cutting methane emissions from human-caused sources by 30% by the end of the decade.
Last December, representatives from major oil and gas companies around the world committed to action that will cut methane emissions by at least 30% by 2030. The Global Methane Pledge (GMP), made at the COP28 summit in Dubai, promises a huge leap forward in the fight against climate change. Partners of this agreement have announced that more than $1 billion of new grant funding will be allocated to support action against methane – more than three times the pre-existing funding levels – and individual action is ongoing to further reduce the impact of these harmful emissions.
More than 150 countries have signed the GMP, committing them to cutting methane emissions from human-caused sources by 30% by the end of the decade. Alongside other newly-announced measures, as part of the pledge certain businesses could face financial penalties for failing to act. The US, for example, plans to introduce a fine of $900 per tonne of methane emitted this year, which will rise by 67% to $1,500 per tonne in 2026.
Approximately 60% of all methane emissions are caused by human activity, and a third of this is produced by the energy sector through flaring, venting, and leaking infrastructure.
Perhaps the most exciting commitment made at COP28 is the launch of the Data for Methane Action campaign. The Global Methane Hub plans to increase the funding available to governments to take advantage of previously unleveraged data. Alongside the full launch of a new Methane Alert and Response System (MARS), energy suppliers could soon have access to a suite of tools and funding to reduce gaps in their understanding of where emissions are occurring, enabling them to act as never before against this invisible threat.
The picture is clear: after decades of limited action, the oil and gas sector is moving in the right direction on methane. But whether these pledges will be met remains to be seen. While the world awaits the new measures to be fully implemented, there is much that the industry can do to show its commitment to reducing methane emissions and firmly positioning itself in the fight against climate change.
An invisible threat
The promises made at COP28 were desperately needed. Methane emissions represent one of the largest threats facing humankind today. Since the Industrial Revolution, this invisible gas has been responsible for approximately a third of the recorded rise in global temperatures.[1] Without immediate action, emissions from human sources are projected to increase by up to 13% in the next six years, causing significant and irreparable harm to the planet.
In terms of trapping heat, methane is around 30 times more powerful than carbon dioxide and other greenhouse gases and persists for a much shorter time in the atmosphere. This means that reducing methane emissions is one of the most effective available strategies for making a difference to the environment.
Approximately 60% of all methane emissions are caused by human activity, and a third of this is produced by the energy sector through flaring, venting, and leaking infrastructure.[2] Estimates suggest that halving these emissions over the next 30 years will be instrumental in meeting the critical goal of reaching global net zero emissions by 2050. Achieving this target is essential for limiting global warming to just 1.5°C; the threshold agreed by scientists, beyond which the environment would suffer irreparable damage.
The GMP saw several new signatories at COP28, including Kenya, Angola, and Turkmenistan, the latter of which in particular has been highlighted as a methane ‘super-emitter’. More than 5,600 super-emitter events have been recorded by UN research since 2019, with little overall reduction observed among many GMP signatories. In certain countries, emissions have even increased.[3] In 2022, two oil and gas fields alone in Turkmenistan were responsible for more global warming than all carbon emissions released by the UK that year.[4]
Of the new regulations, the measures being introduced by the US Environmental Protection Agency look particularly promising. These laws have the potential to prevent 58 million tons of methane pollution over the next 14 years, by mandating thorough pollution control system inspections alongside equipment upgrades. This represents a reduction against current levels of 80% or taking the equivalent of 1.5 billion tonnes of CO2 out of the atmosphere.
The pledge to ending flaring activity by 2050 made by 50 companies will also make a significant difference. Aided by a new $250 million trust fund, this pledge would effectively end the 140 billion cubic metres of methane and other greenhouse gases released by this practice every year. As every tonne of gas flared results in two to three tonnes of CO2 being released, achieving this target will be instrumental to limiting global warming.
A clearer picture
The commitments outlined so far mark encouraging progress in the fight against climate change, but in isolation, will not overcome the main problem facing oil and gas suppliers. Limitations in the data on methane emissions have effectively hidden the scale of the problem, preventing optimised action from being taken.
Improving the accuracy of methane emissions data is widely recognised as the best solution to reducing the amount of pollution emitted. Of course, this action is easier said than done. Most oil and gas operators oversee many thousands of miles of pipelines, rendering manual checks impractical at best and expensive, ineffectual time sinks at worst. As a result, leaking pipelines have been widely accepted as a regrettable cost of doing business for decades.
This is why the announcement of the MARS at COP28 is so promising for the industry. Recent years have seen rapid progress in satellite tracking and other modelling techniques that have significantly enhanced the capacity of oil and gas producers to collect data on their emissions. The MARS is one such system. In collaboration with the Copernicus space programme, it represents the first global system that connects satellite-detected methane emissions with trackable notifications.
In a pilot phase that ran throughout 2023, the MARS identified more than 1,000 methane plumes from energy production and linked 400 of these to specific facilities. Tools such as this are changing the picture of emissions and expanding the available approaches to ensure compliance with global commitments on methane.
This new tool is being supported by a worldwide campaign to encourage more comprehensive data collection. The Data to
Methane Action campaign aims to improve the funding available to governments and businesses to enable radical reductions in methane emissions by targeting leaks and policy change. The campaign encourages improvements in data collection, supported by satellite monitoring systems and scientific monitoring campaigns, providing transformational tools to help the energy sector scale up its efforts.
Action on the ground
While oil and gas businesses wait to benefit from the monitoring systems announced at COP28, they can pre-emptively improve their emissions profiles by taking action on the ground. Thanks to technological advances, businesses today have access to a suite of monitoring solutions for identifying where leaks are occurring, chief among which are high-performance infrared (IR) sensors. These small devices generate beams of IR light that pass through a filter inside a sampling chamber that blocks certain wavelengths.
This means that only the desired wavelengths make it through the filter to a detector, which measures the attenuation of the light it receives to determine the precise concentrations of gases that may be present. Changing filters enables different wavelengths of light to reach the detector, which can, in turn, be used to check for different kinds of gases.
Technologies such as this, combined with the growing international awareness around methane, have the potential to make a real difference to international action against climate change. As other sectors such as agriculture, start to act on the problem, the oil and gas industry has the potential to position itself as a leader in methane reduction strategies.
Advanced emission tracking devices mean leak prevention is no longer a hypothetical concept. Supported by the growing groundswell of funding to improve monitoring solutions, today’s energy suppliers have a wealth of options available to track harmful leaks and start to address them. Improving the total picture of methane emissions through more accurate information must be the New Year’s Resolution for oil and gas businesses – only then can they claim to be truly awake to the problem posed by methane.
Text: MARK NAPLES, Umicore Coatings Services Images: SUHTTERSTOCK, FREEPIK
Subscribe to the free Maintworld newsletter here!
Pinning down possibilities for pump problems

Problems in pumping systems can, seemingly logically, be blamed on the pump. There could however be other hidden issues; ambient conditions can affect pumpage, or perhaps there are problems in the system itself. In this article we discuss a systematic approach to help determine where the problem really lies.
When a newly repaired pump performs poorly, it seems logical that something is wrong with it. While that might be true, good troubleshooting procedures should also eliminate several other possibilities, including problems with the fluid being pumped (the pumpage), or with the pipes, fittings and vessels that are connected to the pump (the system). Fortunately, a savvy technician with just a basic understanding of pump curves and performance parameters can quickly narrow down the possibilities–especially those associated with the pump.
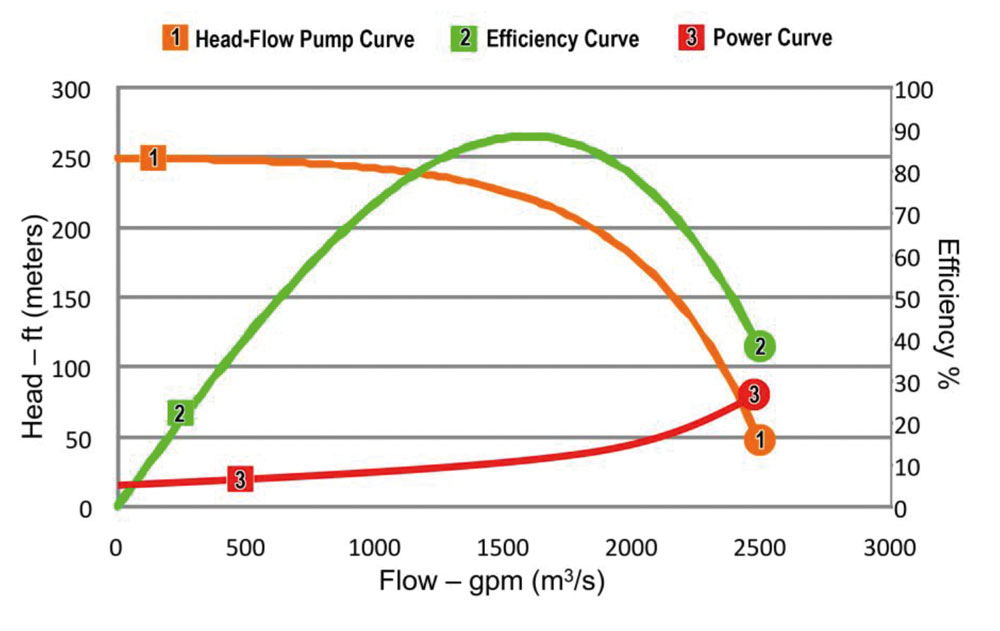
Pump curves
This discussion is limited to the most common pumps in industrial and commercial applications– centrifugal pumps. The performance curves in Figure 1 illustrate how the parameters of head, flow rate, efficiency and power relate to one another for a typical centrifugal pump. Note that as head increases, flow decreases, and vice versa (Head-Flow Pump Curve, Figure 1).
For any certain flow rate, there is a corresponding amount of head. The impeller design dictates a specific flow rate at which the pump will perform most efficiently–i.e., its Best Efficiency Point
Many pump problems, and some system problems, will cause the pump to operate at a point below its normal pump curve line.
(BEP). Many pump problems, and some system problems, will cause the pump to operate at a point below its normal pump curve line. A technician who understands this relationship can measure the pump parameters and isolate the problem to the pump, the pumpage, or the system.
Is it the pump?
To determine if the problem is the pump, the Total Dynamic Head (TDH) and flow should be measured at the pump and compared to the pump curve for that pump (see sidebar on page 49). The TDH is the difference between discharge and suction pressure, converted to feet or meters of head. (Caution: If there is little or no head or flow on start-up, the pump should immediately be shut off to verify that there is sufficient fluid in it–i.e., that the pump is primed. Running a pump dry may damage the seal.)
• If the operating point is on the pump curve, the pump is operating properly. Therefore, the problem is with the system or possibly the pumpage.
• If the operating point is below the pump curve, the problem could be the pump, the system, or possibly the pumpage.
Is it the pumpage?
Ambient conditions like temperature can change the viscosity of the pumpage, which in turn may change the head, flow and efficiency of the pump. Mineral-based oil is a good example of a liquid that changes viscosity with temperature. When the pumpage is a strong acid or base, dilution can change its specific gravity, which may affect the power curve.
To find out if the pumpage is the problem, its properties need to be verified. Tests for viscosity, specific gravity and temperature of the fluid are readily available and inexpensive. Standard conversion charts and formulas from the Hydraulics Institute and elsewhere can then be used to determine if the pumpage is adversely affecting the pump’s performance.
Is it the system?
Assuming the fluid properties have been ruled out, the problem must be with the pump or the system. Again, if the pump is operating on the pump curve, it is working properly. In that case, the problem must be the system to which the pump is connected.
There are two possibilities here. Either the flow is too low (and therefore the head is too high), or the head is too low (indicating the flow is too high). When considering head and flow, remember that the pump is operating on its curve. Therefore, if one is too low, the other must be too high.
Low flow (head too high). A low flow condition usually indicates a restricted line. If the restriction is in the suction line, there will likely be cavitation; otherwise, it is probably in the discharge line.
Other possibilities are that the suction static head is too low, or that the discharge static head is too high. For example, a suction tank may have a float switch that fails to shut off the pump when the fluid level drops below the set point. Similarly, a discharge tank may have a “high level” switch that has malfunctioned. a discharge tank may have a “high level” switch that has malfunctioned.

Low head (flow too high). A low head condition indicates too much flow. And it is likely that the flow is not going where it should. System leaks can be internal or external. A diverter valve that allows too much flow to bypass, or a failed check valve that lets flow circulate backwards through a parallel pump, would result in too much flow and low head. On a municipal water system with buried water mains, a major leak or line break will allow too much flow and result in low head (low line pressure).
Blockages and leaks. Looking for blockage or leaks in a hydraulic system is like looking for opens and shorts in an electrical system, except that the parameters to measure are pressure and flow rather than voltage and current. Where there is a blockage or a leak, there will be an abnormal pressure differential across the area or component involved. It is easier to locate a problem by checking pressure (THD) than by measuring flow (see sidebar).
Other system problems. Even if the pump is not operating on its curve, there are some system problems that must be ruled out before the pump can be identified as the culprit. For example, if vapor is getting into the pump by air entrainment or cavitation, the pump will not operate on its curve, even if there is nothing wrong with it. Performing vibration analysis in real time while varying the pump suction will help identify cavitation and air entrainment. If the pump does not operate on its curve after these conditions have been eliminated, there is very likely a problem with the pump.
What could be wrong with the pump?
When a pump does not operate on its curve and cavitation and air entrainment have been eliminated, the most likely causes are a damaged impeller, blockage in the impeller (see Figure 3), blockage in the volute, or excessive wear ring or impeller clearance. Other causes would be related to the speed of the pump, such as the shaft spinning in the impeller, or an incorrect drive speed. While drive speed can be verified externally, investigating the other causes will involve opening the pump.
Conclusion
Troubleshooting pump performance is straight-forward. By measuring the pump’s head and flow and comparing the results to the manufacturer’s pump curve, and checking for air entrainment and cavitation, the technician can readily determine if the problem is with the pump or the system. The properties of the pumpage can also be tested to rule them out as the cause of the problem.
Measuring pump operating parameters
Often the most difficult parts of troubleshooting pump performance is measuring the pressure and flow. To determine pump TDH (i.e., the difference between the suction and discharge pressures), a suction gauge and a discharge gauge are required at both the pump suction and discharge. Pump suction pressure can be below atmosphere (a vacuum), so the suction gauges should read vacuum or pressure.
Although flow can be harder to measure than pressure, ultrasonic flow meters can accomplish the task from the outside of the pipe (Figure 2). There are several kinds that may work, depending on the type of pumpage, so it is important that the correct type is selected, and that it is installed and calibrated properly.
Another way to determine flow is a method which works well on pumps that draw from an open sump. Simply measure the change in depth of the liquid during a short interval (15–60 seconds) with all other flows into and out of the sump closed. Compute the flow as the volume of the change in sump level, converted to gallons (m3) per unit time.
EASA is an international trade association of more than 1,700 firms in nearly 70 countries that sell and service electromechanical apparatus. For more information, visit www.easa.com .
Text: Gene Vogel, pump and vibration specialist at EASA
Images: EASA and SHUTTERSTOCK
Subscribe to the free Maintworld newsletter here!
Sustainability Reporting – a Necessity or a Competitive Advantage?

The new EU Corporate Sustainability Reporting Directive (CSRD) came into force at the beginning of this year. It will gradually extend sustainability reporting to almost all European listed companies by […]
The new EU Corporate Sustainability Reporting Directive (CSRD) came into force at the beginning of this year. It will gradually extend sustainability reporting to almost all European listed companies by the end of the decade. It will also cover foreign companies with significant operations in the EU.
In the first phase, the reporting obligation will apply to the largest companies, i.e. listed companies with more than 500 employees, and large national public utility companies. They will be required to report sustainability issues in their 2025 financial statements based on data collected for that year according to CSRD standards. From the start of next year, sustainability reporting will be extended to larger mid-sized companies, and from 2026 the obligation will also cover listed SMEs. In the future, sustainability reporting will therefore be mandatory for all listed companies except for the smallest micro companies.
Replaces sustainability reporting
In practice, the reform corrects the previously criticized patchy and inconsistent sustainability reporting. The aim is to harmonize the content, reliability, and comparability of corporate sustainability reporting. This will make it easier for partners, investors, and financiers for example, to access information and assess how responsible a company is in practice and whether it is meeting the EU’s green sustainability goals.
The aim is to increase transparency and highlight how non-financial information affects business performance. The focus of the reporting is on the ‘double bottom line’: on the one hand, to look at the impact the company’s business has on people and the environment, and on the other hand, to measure how different sustainability factors in turn impact the business.
The impact of the assessment
The CSRD will create additional work for companies, as they will also have to report on all indirect emissions from their value chain (scope 3). In addition, reporting processes and data will need to be of high quality and independently validated.
Each sustainability issue is assessed not only in terms of its impacts but also in terms of the risks and opportunities it presents. Looking beyond the company’s operations, for example to the supply chain, will improve the company’s understanding of its operating environment and the associated threats and opportunities. The EU hopes this will encourage companies to make more conscious investments in green and sustainable development and, among other things, to invest in building a more socially just working life.
At the same time, reporting can bring significant benefits and advantages for companies: for example, it will be easier to convince investors or financiers of the genuine green and responsible nature of a company’s activities if there is verified evidence of these. And, especially in the early stages of the directive’s implementation, fast adopters can use the information as a competitive advantage to differentiate themselves from other producers and to attract the best employees and partners into their chain.
CSRD scope
2024
1st reporting phase (large companies, i.e. those already covered by the Non-Financial Reporting Directive (NFRD)) financial statements 2025.
2025
Reporting obligation for listed companies with at least 250 employees/net turnover of €40 million/balance sheet total of €20 million (2 criteria to be met).
2026
Reporting obligation for listed SMEs. The first reports are to be published in 2027 (2026 data). If data is not collected immediately, the company has a 3-year transition period to implement sustainability reporting.
2027
The three-year transition period for SMEs to start sustainability reporting starts.
2028
Non-European companies with a net turnover in the EU of more than €150 million and at least one subsidiary above the thresholds to be covered by sustainability reporting (reporting in 2029).
Text: Nina Broström Images: Shutterstock
Subscribe to the free Maintworld newsletter here!
Latest